A Proposed Causal Relationship Between Social Media and Mental Health
I started this project curious about the increase in teen mood disorders and suicide. Through investigating that, I started to get curious about the impact that social media use can have on the mental health of adolescents, from there, the question became, why does social media use have the impact it does? In my opinion, this is where the project got interesting, because it devolved into an investigation into the impact of network structure on behavior, and there are some interesting and colorful models involved.
Typical Risk Factors Have Decreased …
Alcohol and Drug Use
Access to Firearms
… But teen suicide has increased
Suicidal Ideation
For over a decade, suicidal ideation tracked with alcohol and drug use, decreasing together. However, in the late 2010s they started to decouple.
Suicide
The same happened with actual acts of suicide in the late 2000s, as rates started increasing despite typical risk factors continuing to fall.
What else changed in this time period?
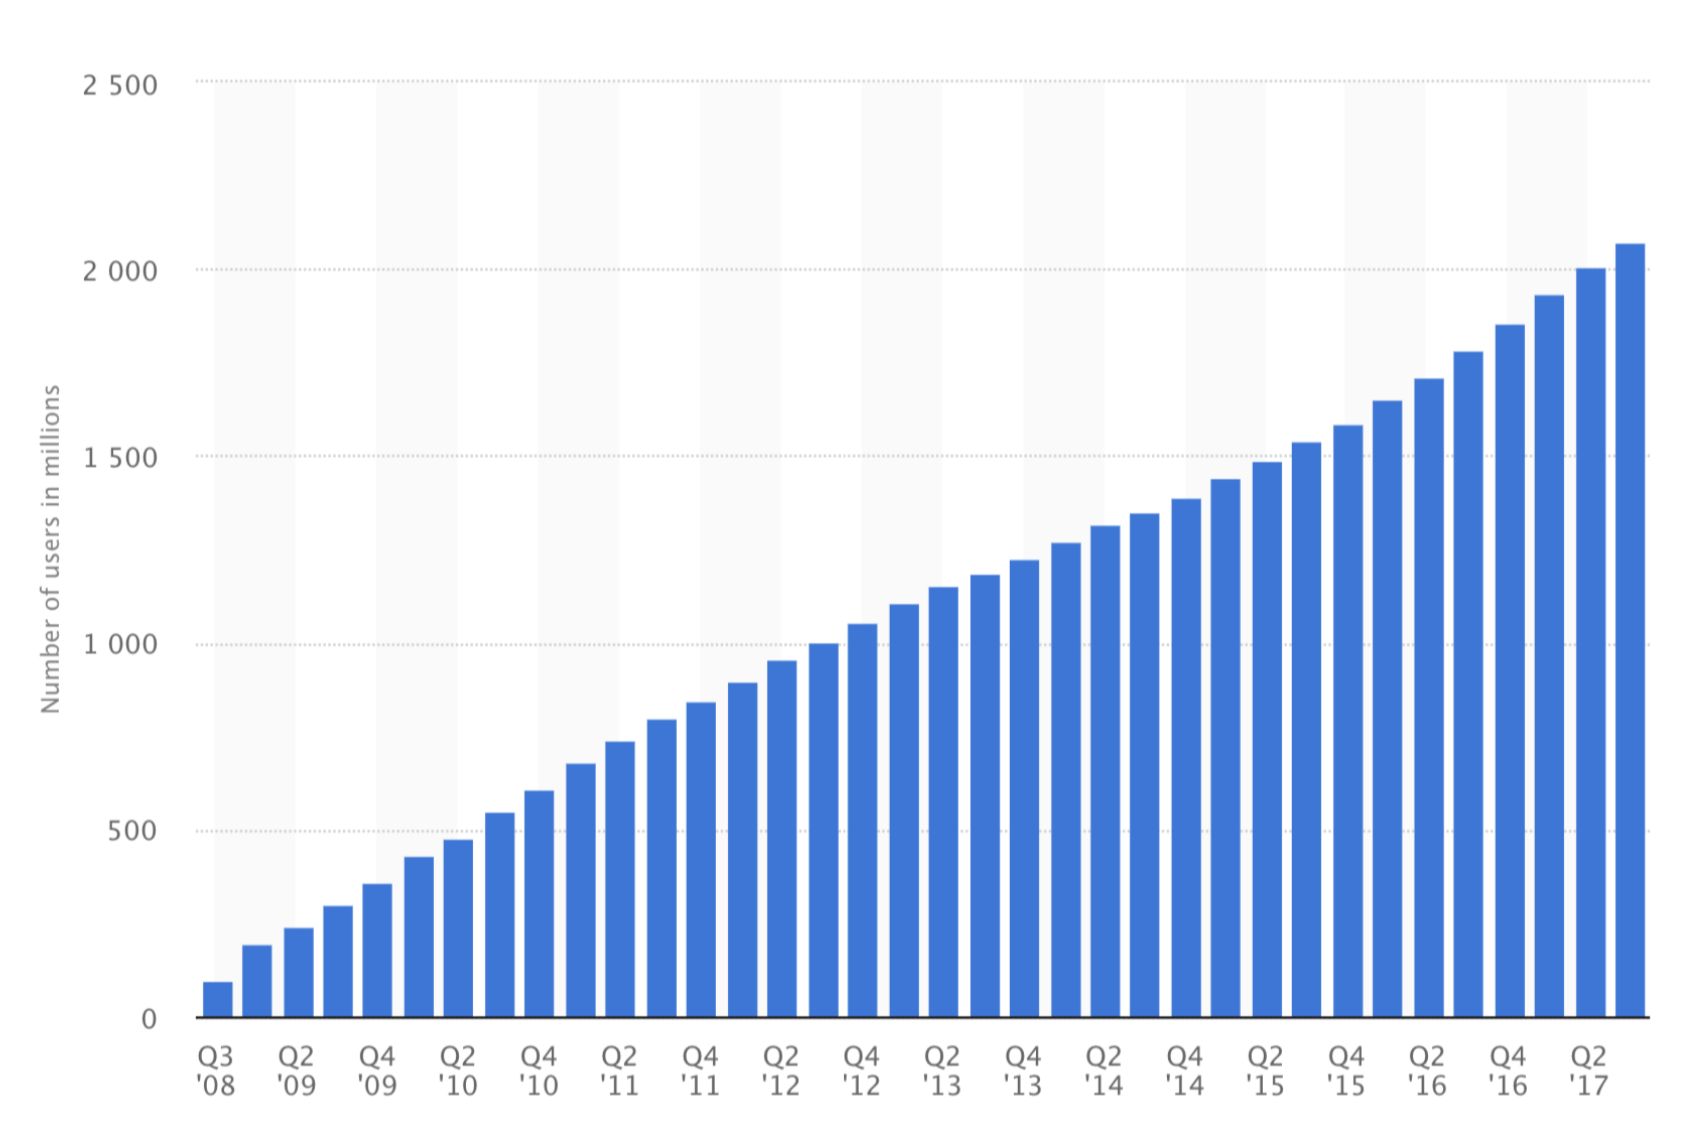
One dramatic behavioral shift was the widespread adoption and use of social media among young people:
Facebook Users
(Facebook)
Teens’ weekly time spent on social media (2016)
(Monitoring the Future Study)
Tablet/Mobile Phone Use and Mental Health
(Babic et. al)
There’s growing evidence that high levels of social media usage has a negative effect on mental health in adolescents, however, the nature of the relationship is tricky to determine:
Cause, Symptom, or Neither?
The cross-sectional nature of these studies makes directionality tricky to infer:
Does spending more time on social media make you more depressed?
or do more depressed people naturally spend more time on social media?
Adults who use social media actually become less depressed! How confusing…
One social media related issue that seems to uniquely affect adolescents, is cyberbullying, which raises the question:
Why do people seem to be so much meaner online?
Changing Social Structures
One fascinating aspect of social media is that the nature and “shape” of our connections is very different than that of our offline interactions.
If we were to model our social connections as a network, our in-person and online social networks have very different features, compared to in-person, online social networks have:
Higher average node degree (this is how many other dots, or nodes, each dot is connected to)
Lower average path length (this measures how interconnected the network is)
Less clustering. Our connections in offline social structures are more likely to know each other. This is partially a result that in-person social interaction is somewhat physically bound.
On the right, I’ve mocked up an example of these two different sorts of networks, with the “Small Neighborhood” representing an offline social network, and the “Big Neighborhood” representing an online social network.
But how does a network’s structure affect the behavior of its constituent members?
Iterated Game Theory in Networks
Let’s have the members of networks interact with their neighbors. To model this interaction, they’ll be playing the Prisoner’s Dilemma.
A brief aside about the Prisoner’s Dilemma:
The Prisoner’s Dilemma is the most famous game theory “game”, and works like this:
Two players are playing together
They each have the opportunity to “Cooperate” with, or “Defect” on their partner.
The choice is made simultaneously.
If they both cooperate with each other, they each receive a payout of 5.
If one player defects, and the other cooperates, the cooperator receives a payout of 0, and the defector receives a payout of 10.
If both players defect, they both receive a payout of 1.
The crucial aspect of this game is that each player always has an incentive to defect. If your partner is going to cooperate? You would get 5 for cooperating, but 10 for defecting! If your partner is going to defect? You would get 0 for cooperating, but 1 for defecting.
The tragedy is that if both players follow this logic, and play their optimal strategy (defecting), they will end up with the lowest cumulative outcome (2)! By looking out for themselves, they ended up creating a very bad situation for everyone. Ayn Rand weeps.
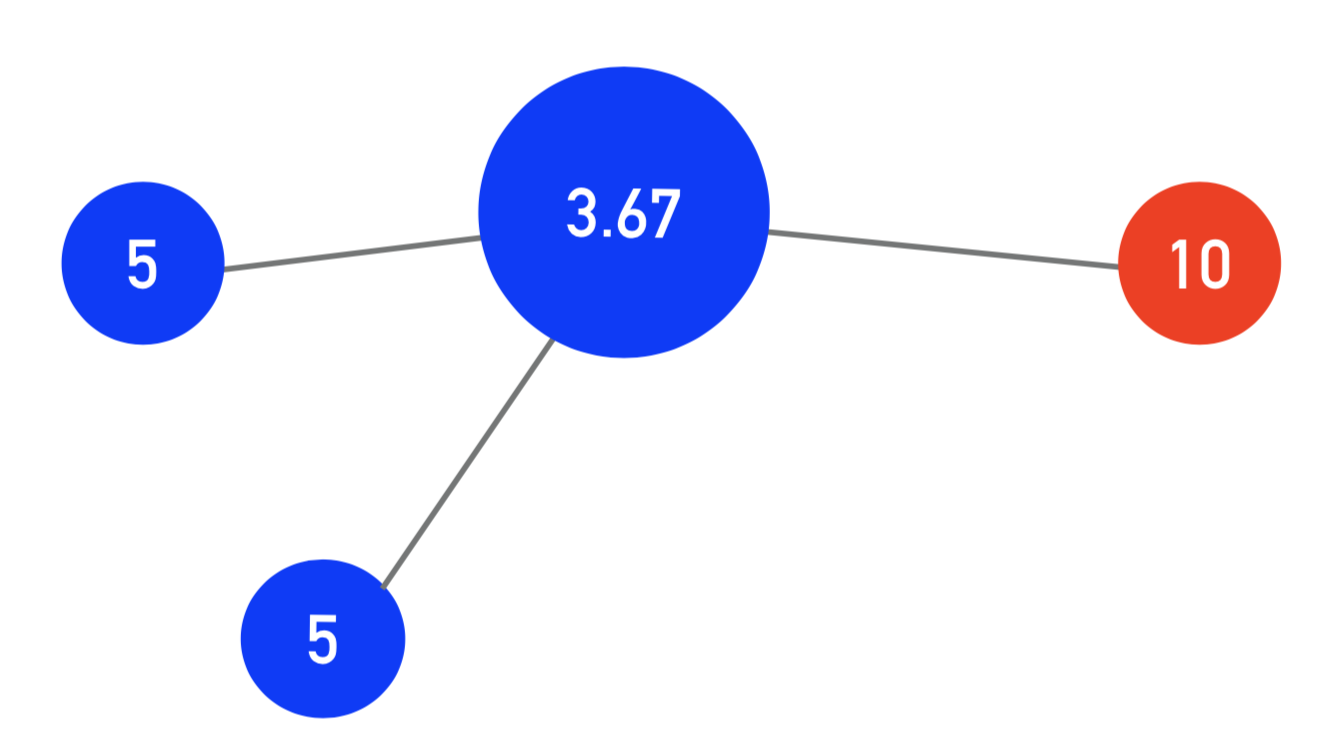
To demonstrate, let’s have a small network play: —>
Cooperators are blue, defectors are red. Score is calculated by averaging a node’s result against all of its neighbors. For the dot in the center, a cooperator, it plays with the cooperative top left node (5), the cooperative bottom left node (5), and the defector on the right (0). The center node’s score is therefore (5+5+0)/3 = 3.67. For the node on the right, its score is 10/1 = 10.
Replicator Dynamics
Now, you may be saying, “This all makes sense so far, but it seems just like “Game Theory in Networks”, what makes it iterated?”
Good question. We’re going to repeat the game hundreds, or even thousands of times. After every round, like the round we just did by hand on the left, nodes will adopt the strategy of their most successful neighbor (including themselves). In this case, the nodes on the left would both keep their strategy (cooperation), the node in the center would adopt the strategy of the defector (as 10>5>3.67), and the node on the right would keep its strategy.
In the subsequent round, the two nodes on the right would both be defectors, and the two nodes on the left would both be cooperators:
Iterated Games in Networks
To run these games on networks with different structures, I’ve written some simulations in NetLogo. Let’s look at two of them here. For these, each pixel is equivalent to a node in the above diagram. The nodes in the simulation with Big Neighborhoods are more highly interconnected, and the nodes in the simulation of Small Neighborhoods are less interconnected.
Color Coding:
Blue = Cooperator this round and the previous round
Red = Defector this round and the previous round
Green = Cooperator this round, defector the previous round
Yellow = Defector this round, cooperator the previous round
Big Neighborhoods
Let’s start with 90% cooperators with all of the nodes structured in big neighborhoods (networks more similar to online social networks). Here we see that although we start out with mostly cooperators, within a fairly short time, all nodes have adopted the strategy of “Defect”.
Small Neighborhoods
Let’s have the same starting conditions as the Big Neighborhoods simulation (90% cooperators), however, this time, all nodes don’t adopt the strategy “Defect”. In fact, we seem to end up in an unstable equilibrium, with patches of cooperation and defection roiling through the topology.
Why is this the case? Why do networks comprised of smaller neighborhoods seem to be more resistant to the invasion of the “Defect” strategy?
An important point to remember here is that even though an individual node can always do better by defecting, the total payout on a board of all defectors is much lower than the total payout of any other board.
…
Let’s take a closer look
Here’s an initial state for a network comprised of two connected small neighborhoods. As we can see in the right neighborhood, there is one defector, who has done very well preying on the cooperators, in the subsequent round, those cooperators will adopt his strategy.
In the subsequent round, as predicted, all of the nodes in the right neighborhood have adopted the strategy “defect”, however, it will not spread to the left neighborhood. The fact that the node with a score of 3.75 is surrounded by other cooperators offers some degree of protection. In fact, in the next round, the node with 3.25 will actually become a cooperator again. The strategy “Defect” will not “spread” through the network as we saw it do in the networks comprised of big neighborhoods.
But what does this actually tell us about teens on social media?
This isn’t a perfect representation of behavior online or in person, but it doesn’t have to be. The important takeaway is that networks that are structured more like social media networks are much more susceptible to rapid spread of novel behavior, and these networks are particularly vulnerable to the spread of behavior which is on the whole bad for the individuals on the network! In contrast, there are more direct consequences to bad action in networks with smaller neighborhoods, a protective mechanism that can prevent self-destructive behavior from permeating to other neighborhoods.
Interestingly, this protective effect is present even when we start with 90% defectors. We still reach that unstable, and somewhat psychedelic equilibrium:
One more fun aside:
If we look at the search frequency for “Teen Depression,” it drops dramatically in December every year, around the time that adolescents are returning home to tight-knit social structures.
Closing thoughts:
Humans are deeply social creatures!
The structure that our social interactions happen within matters. It can affect the sort of behavior that arises.
The increase in teen depression and suicide at least seems to be correlated with an unprecedented rise in social media use.
One, often ignored feature of social media is the way it shifts the structure of our social networks
These larger, more interconnected social networks are inherently more vulnerable to harmful behavior than smaller, more insular networks.


