Modeling the Effects of Mask Noncompliance
Introduction:
In the US, masks have unfortunately become a topic unto themselves in the fight against coronavirus; they were at first a symbol of a failed state that wasn’t prepared for a pandemic, didn’t have sufficient stockpiles for medical workers, and was either unable or unwilling to mobilize production to create more. Then the CDC’s reversal on mask policy (from “ineffective, only for frontline healthcare workers” to “recommended for everybody”) for some felt like vindication of their distrust of institutions, and for others felt like a necessary deceit for the greater good. Finally, as parts of the nation start to reopen, masks have become, worst of all, a political flashpoint. For an outspoken minority, a store’s request that all patrons wear masks is an affront to America’s very nature, an impingement on their freedom, and somehow, connected to a liberal plot to sink Trump’s presidency.
I don’t think it’s very useful to discuss the actual thought process behind any of this, but here’s my interest:
If we reopen society, and some proportion of the population refuses to wear masks, how large does this proportion have to be before the virus begins spreading uncontrollably? Or, to be more nuanced, how high does this percentage have to be before we see a significant increase in cases? How much does mask compliance matter???
Methods:
Let’s build a NetLogo agent-based model where the following assumptions are true:
When nobody is wearing a mask, the disease spreads uncontrollably through the population
Masks reduce the chance of transmission
In this model, the agents in the population move randomly throughout the space. If a sick person comes in direct contact with a healthy person, the healthy person becomes infected. The disease lasts for an average of two weeks, with 99% of people surviving and becoming immune. Once they no longer have the disease and are immune, they can no longer infect others.
For both realism and simplicity, people are either wearing masks or they aren’t, they can’t put one on once they become infected (in the real world, many spreaders don’t even realize they’re sick until it’s too late).
How well do masks work? It’s not clear! There are a lot of conflicting opinions, and not much evidence in any direction.
Again, for both realism and simplicity, we will make the assumption that masks are not protective for the wearer, and their benefits come primarily from preventing a sick person from spreading the virus. Japanese health officials believe high rates of mask wearing were a huge part of their ability to contain the virus, and most public health officials now recommend them for going outside. Putting numbers on how effective they are, however, is very difficult. Because of that, we’ll use a wide range of efficacies, ranging from 0% Transmissibility (if you are wearing a mask, you cannot transmit the disease) to 90% Transmissibility (mask wearers are 90% as likely to infect a healthy person they come in contact with as they would be if they weren’t wearing a mask).
Simulation
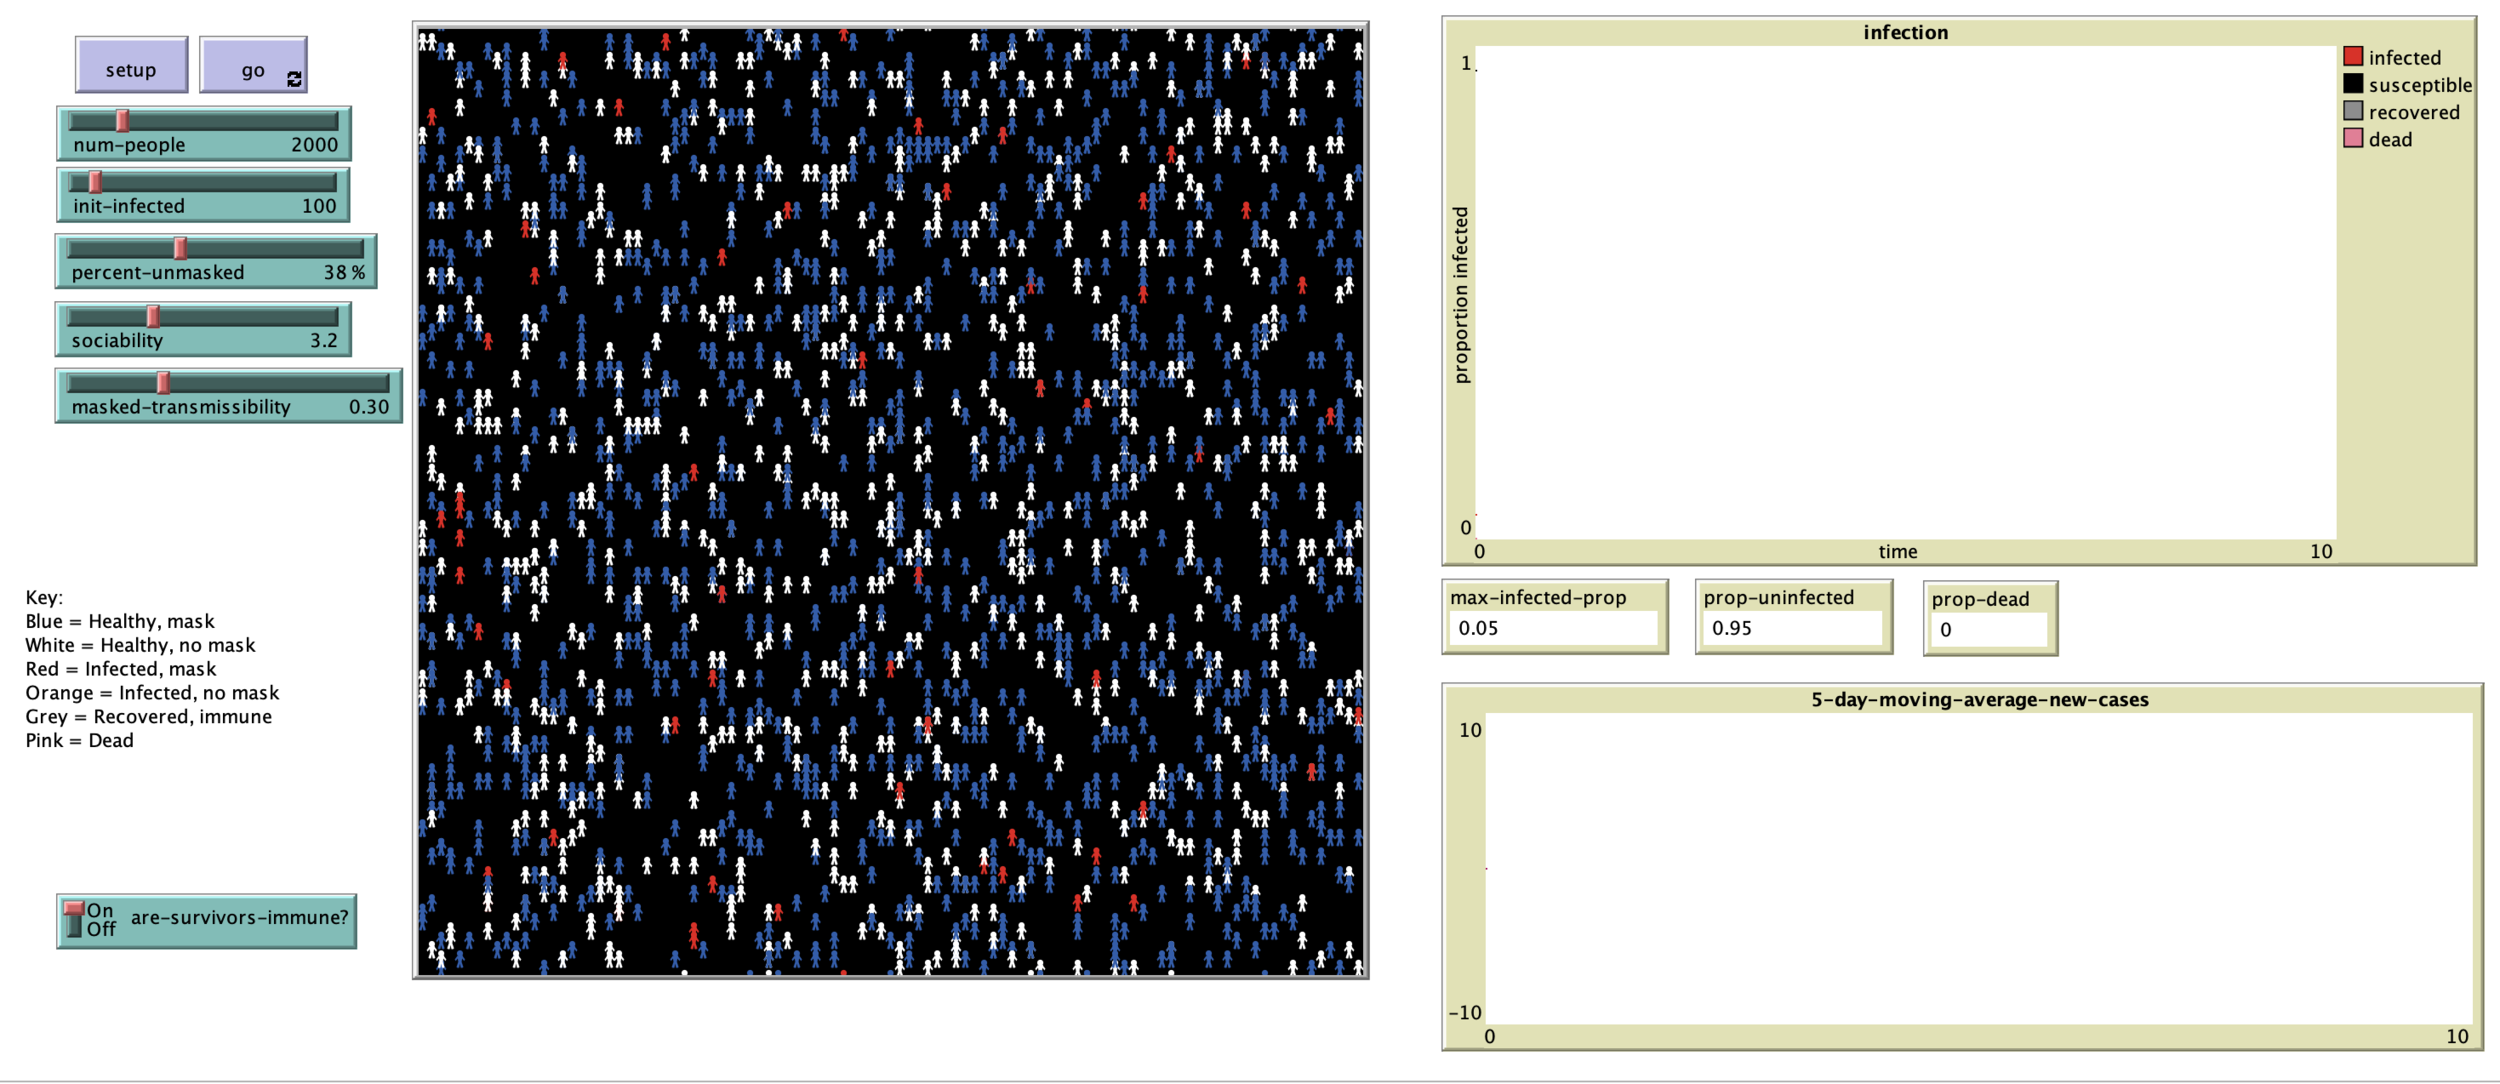
Here is what the simulation actually looks like before we run it. I’ll walk through all of the adjustable variables on the left:
num-people: this is how many agents are in the population. For every simulation used in this investigation, I used a population of 2000.
init-infected: this is how many agents are infected at the start of the simulation. For every simulation I used 100.
percent-unmasked: this is the percent of people who are not wearing a mask. This was varied in the experiments.
sociability: this is how active the agents are, how much they move around each day. This stayed constant in all experiments.
masked-transmissibility: (as discussed above) when a healthy person comes in contact with a masked sick person, this is the chance that the healthy person gets sick.
Here is what the simulation looks like after it has been run for a year with nobody wearing masks.
Important things to notice:
prop-uninfected is basically zero. Nearly everybody has contracted the virus at some point
max-infected-prop is very high. If we look at the graph showing the proportions of the population that are infected, susceptible, recovered, and dead, max-infected-prop tells us what the peak of the red line is. This is important for two reasons:
It gives us a proxy for how quickly the infection has burned through the model population
This was the curve that we were trying very hard to flatten at the start of the pandemic! If the number of people sick at any given moment even approached 30% of the population, the healthcare system would be uselessly overwhelmed, many times over
Here’s what it looks like after the simulation is run for a year with moderately effective masks (30% transmissibility), and moderately high mask non-compliance (35% of people are not wearing masks)
The red curve (number of infected) is noticeably flatter, and we can see the max-infected-prop is nearly half what it was in the simulation where nobody was wearing masks. Most people (77%) still ended up getting the virus, but we can see that this community was not hit as hard as the community with no masks.
Ok, so what? If masks are effective, they slow down the infection. That seems obvious. So what? So what???
Yes. You are right, this is obvious. What I am interested in is the shape of the relationship between mask compliance and improved health outcomes! Do total infection rates, or peak infection rates decrease linearly with increased mask wearing? Or is there some magic cutoff point where once x% of the population is wearing masks, we slow the spread, but prior to that, they don’t do much (because remember: masks don’t protect the wearer from infection, they only prevent the wearer from spreading infection)?
To try to sort this out, we are going to run a couple thousand simulations for a year, and look at the resulting max-infected-prop and prop-uninfected numbers, to understand how different mask compliance rates affect them.
Results
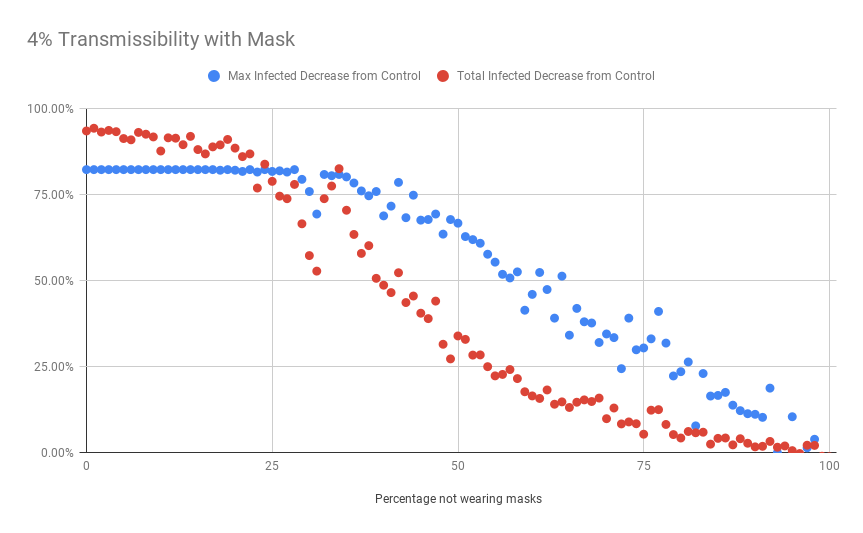
I simulated one year of the virus spreading through a community with every level of mask compliance, as well as varying degrees of mask-efficacy. The two variables I am charting are:
Max Infected Decrease from Control
If “Max Infected” is the highest peak of the infection, this variable shows how much lower the amplitude was of this outbreak when compared to a population with zero masks. For example, the average Max Infected proportion in a population with zero masks was .28 (ie 28% of the population was sick at the same time). In a simulation where half of the people were wearing masks, and masks had 30% Transmissibility, the Max Infected proportion was .16, or a 43% decrease from the control. In short, the higher this number is, the more effective the masks were.
Total Infected Decrease from Control
This variable measures how many fewer people in total were infected when compared to the control group. In the control group, where there were zero masks, 95% of people ended up contracting the virus. If, with masks, half as many people contracted the virus before it burned itself out, it would be a 50% decrease from the control. In short, the higher this number is, the more effective the masks were.
So what do we see? A non-linear relationship! Let’s look through the results of some of the different mask efficacies.
At least with these highly effective masks (the graph on the left shows masks that completely prevent the wearer from spreading the disease), there does in fact seem to be a degree of “herd immunity” created by the masks that allows for some buffer of noncompliance before we lose their benefits to the community as a whole. With extremely effective masks, you can have as much as 25% of the population not wearing them
Interestingly, the impact masks have on decreasing the maximum peak of infections is fairly robust, persisting even after nearly 50% of people stop wearing masks.
But, as we know, 0% transmissibility is not a realistic model, so let’s look at some other mask efficacies.
It turns out we actually see a very similar pattern even when there is a more realistic (at least when compared to the above) estimate of mask efficacy. Widespread mask use genuinely does seem to “flatten the curve,” even when you don’t have universal compliance. Interestingly, the ability of masks to lower the total number infected is not nearly as robust. As soon as 25% of people have stopped wearing masks, you lose nearly 50% of the benefit conferred (in terms of total infected).
What’s the value of masks? It depends what you’re trying to prevent! They seem highly effective at decreasing the peak of the pandemic, but less effective at decreasing the total number infected (unless you have very high rates of compliance)
The trend becomes a little harder to visualize, but still pretty evident once you get into the territory of “not-super-effective-masks”. With high compliance rates, we’re still decreasing the peak of infections by nearly half!


